At FE fundinfo we understand the challenges fund associations face when collecting and reporting accurate and timely market data. We have been enabling the Danish (Investering Denmark) and the Norwegian (Verdipapirfondenes Forening) fund associations to report on market statistics since 2002 and 2006, respectively.
Our market statistics offering is built on our extensive data expertise and is constantly evolving to incorporate the latest changes to industry standards, providing you with an efficient, customisable and transparent solution.
How we can help

Efficiency
Our market statistics solution brings together all the static and dynamic data you need in one place, reducing manual collation processes and saving you time.

Transparency
Comprehensive dashboards provide additional control over your data, giving you the ability to publish your data with accuracy and confidence.

Customisation
We understand that every business’ reporting requirements are unique, that’s why we’ve built customisable reports which you can generate and export at any time.
Market Statistics for Fund Associations
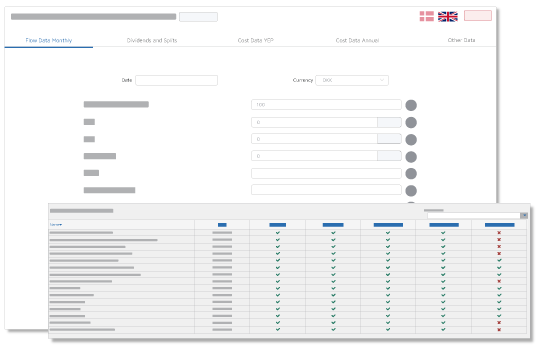
Intuitive navigation
The market statistics solution consists of different modules, allowing fund associations and individual data reporters to collect, control and publish their market data based on their unique requirements. Our market statistics platform offers intuitive navigation and is an efficient platform for the management of any data set.
Comprehensive on-demand reporting
Individual sets of data are saved within the database and can be easily exported with one click. The master query tool combines static data with numerical data points, allowing you to create comprehensive on demand reports that can be downloaded in different formats and consequently published.
Bespoke dashboards
Integral to our market statistics solution are bespoke dashboards, developed to provide an additional level of control over the data collected in the system. Our dashboards use pre-defined formulas that visually display the results, allowing you to easily spot any potential deviations.
Discover how we can help you
Find out more about how FE fundinfo can help your fund association report, collect, control and publish market data.