Increased regulatory and administration requirements have pushed advisers towards outsourcing many processes, including portfolio management. With new Consumer Duty regulation, it is vital that due diligence is not only thorough, but also clearly evidenced and reported. This year’s FE fundinfo Adviser Survey found that the FE Analytics MPS Directory was the second most used method for undertaking due diligence after in-house research. Read on to find out how you can make the most of this powerful tool.
The MPS Directory, available via FE Analytics, now has over 75 of the UK’s most used MPS Providers listed. This allows advisers to conduct extensive research and due diligence across a range of model portfolios, all in one place. We receive data directly from the providers to ensure that you always have access to full, accurate, and up-to-date performance history and information for each model portfolio listed.
One of the common complaints when researching model portfolios is whether you are comparing like with like due to the variety of terminology and benchmarks used by providers. Our FE fundinfo Risk Score presents an easy-to-understand measure of volatility relative to the UK large cap index of the 100 largest companies – demonstrating the consistency of a portfolio’s risk profile in both the immediate and long-term, when compared to the market.
Accessing the MPS Directory
The MPS Directory can be found under 'Portfolio Tools' in the left-hand menu panel within FE Analytics.
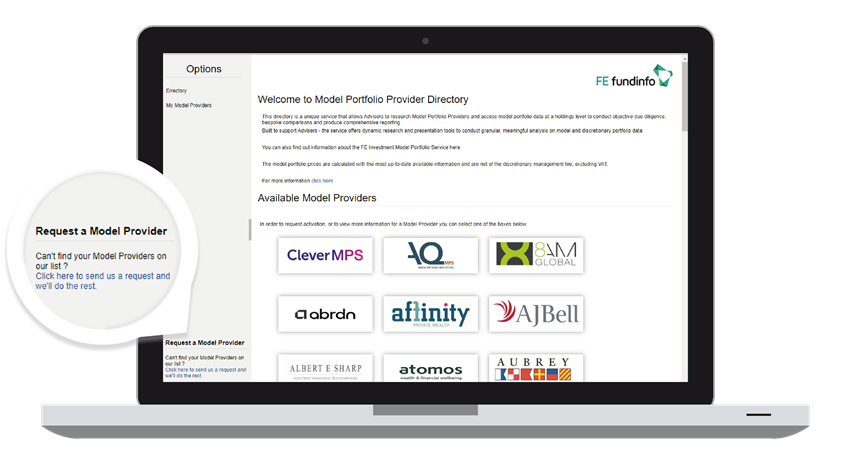
Once you have opened the directory, you will then be able to explore the 75+ providers that we include. Selecting any of the providers will take you to an overview of who they are and their models. If you are interested, you then have the option to 'Activate Me' or 'Request Info' through the buttons in the bottom right of the page.
'Activate Me' will send a request to the provider to allow you access to the models - please be aware that this can take up to 24 hours. Once you have been activated you can undertake the research necessary to choose a particular model.
Can't find the provider you're looking for? Request it within the Directory through the link highlighted below.
Researching models
FE Risk Score
The FE Risk Score can be found in the individual model portfolio short, medium, or long scans. These can be easily accessed by selecting your chosen portfolio in the 'My Model Providers' tab in the MPS Directory and navigating to the 'Reports' tab in the header of the pop-up.
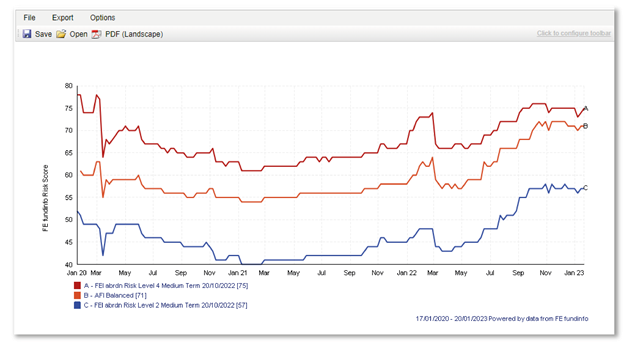
Comparing risk scores
Alternatively, the risk scores of two different portfolios can be compared by adding both portfolios to the 'Active List' on the Analytics front page and selecting 'FE Risk Score Chart' from the charts tab on the right-hand side.
ESG
It's becoming increasingly important for you to have easy access to a range of ESG-related information, so you can evaluate the ESG credentials of funds and make an investment decision aligned with your clients' objectives and values.
Currently we have 3rd party ESG Ratings available within FE Analytics from ISS. To find these ratings within the MPS Directory whilst conducting research, first select your chosen model, and the individual fund ratings can then be found in the factsheets and medium/long scans stored under the 'reports' tab.
With all this ESG data at your fingertips, you can confidently research and assess suitable investments for your clients and meet the requirements of Consumer Duty by demonstrating and evidencing your commitment to supporting your clients to achieve their financial goals.
Visit our ESG solutions page to read more.

Performance Charts
Comparing the current portfolio
When deciding on a new model for a client, it is important to undertake the necessary due diligence to ensure that they will no be worse off in the new portfolio. Whilst due diligence isn’t a new concept, new Consumer Duty laws will place more focus ensuring that a product provides value and is appropriate for the client, and requires that this is transparently evidenced in the research. Therefore, being able to directly compare the historical performance of the new model against a client's existing model is an invaluable tool when researching providers. This can easily be done by adding both the suggested new model and the client's current model to the 'active list' and creating a performance chart from the right hand 'charts' tab.
Effectiveness of the DFM
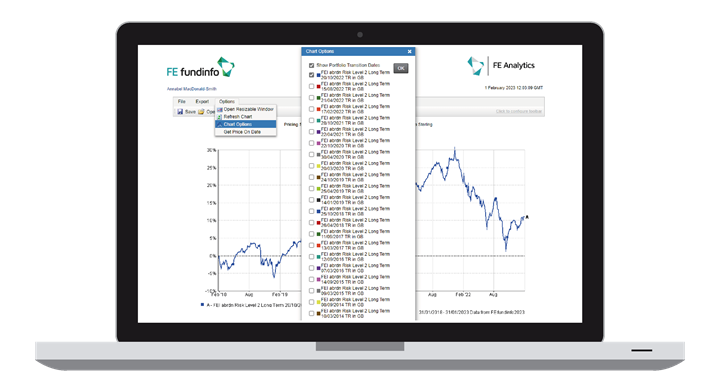
Performance charts allow you to track the historical performance of the model whilst also providing analysis into the performance of any rebalances, therefore giving an insight into the efficiency of the fund managers within a specific portfolio. By selecting 'chart options', you can select any previous rebalance points and graph 'what if' scenarios that would have happened had the rebalance not occurred.
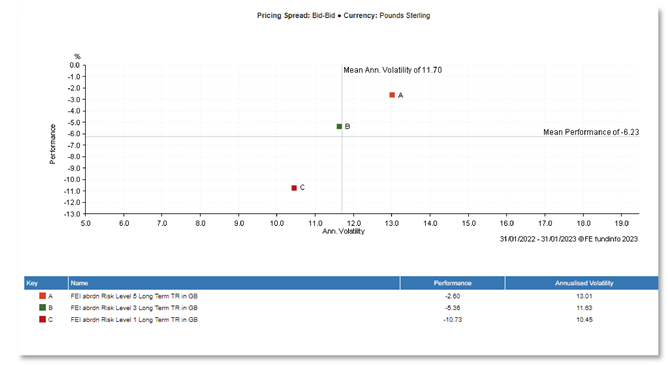
Risk and Reward Scatter Charts
Compare the risk and reward profile from a range of model portfolios over longer and shorter-term periods to ensure that they match the client's attitude to risk. Our scatter charts offer a great way to present this against their benchmarks or in contrast to a client’s existing proposition to ensure that a model is providing value.
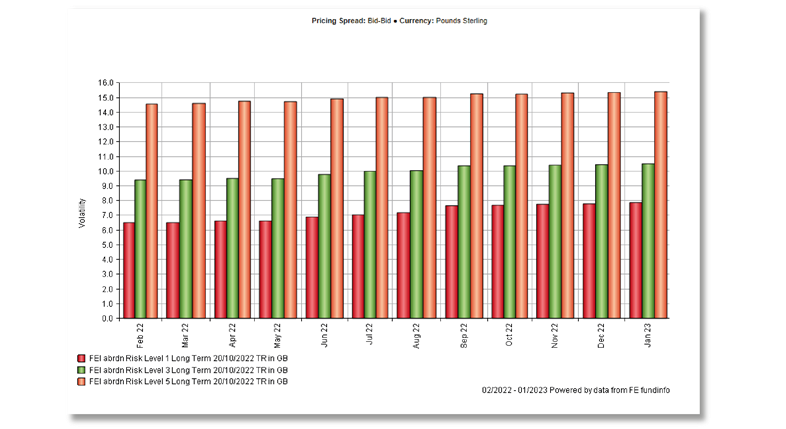
Bar Charts
Our bar charts offer 18 different measures to help you comprehensively review risk and reward profiles, including volatility.
To access bar charts, simply add the chosen model portfolio to the active list and select 'bar chart' under the charts tab on the right of the screen.